Zili Lab
Duration: 18 months
Academic research on mobile usability
Team: 1 PhD PI, 7 research assistants
My role: research design, prototyping
Background
Good UX designs help us better interact with the world and satisfy our goals. However, the effects of bad UX designs are seldom investigated. We hope to better understand how people select, use and interpret different types of information in a context of frustrating product experience with a simplified messaging app. We also wish to utilize commonly used industry UX research tools (usability testing, qualitative coding, bootstrapping, etc) to validate their effectiveness.
Research questions:
What kinds of UX design decisions affect commonly used chat apps the most?
What kinds of UX features frustrate users most?
What kinds of UX research strategies are most effective in interpreting bad user responses?
Are there any external factors (personality, relationship to researcher, research setting) that affect user feedback?
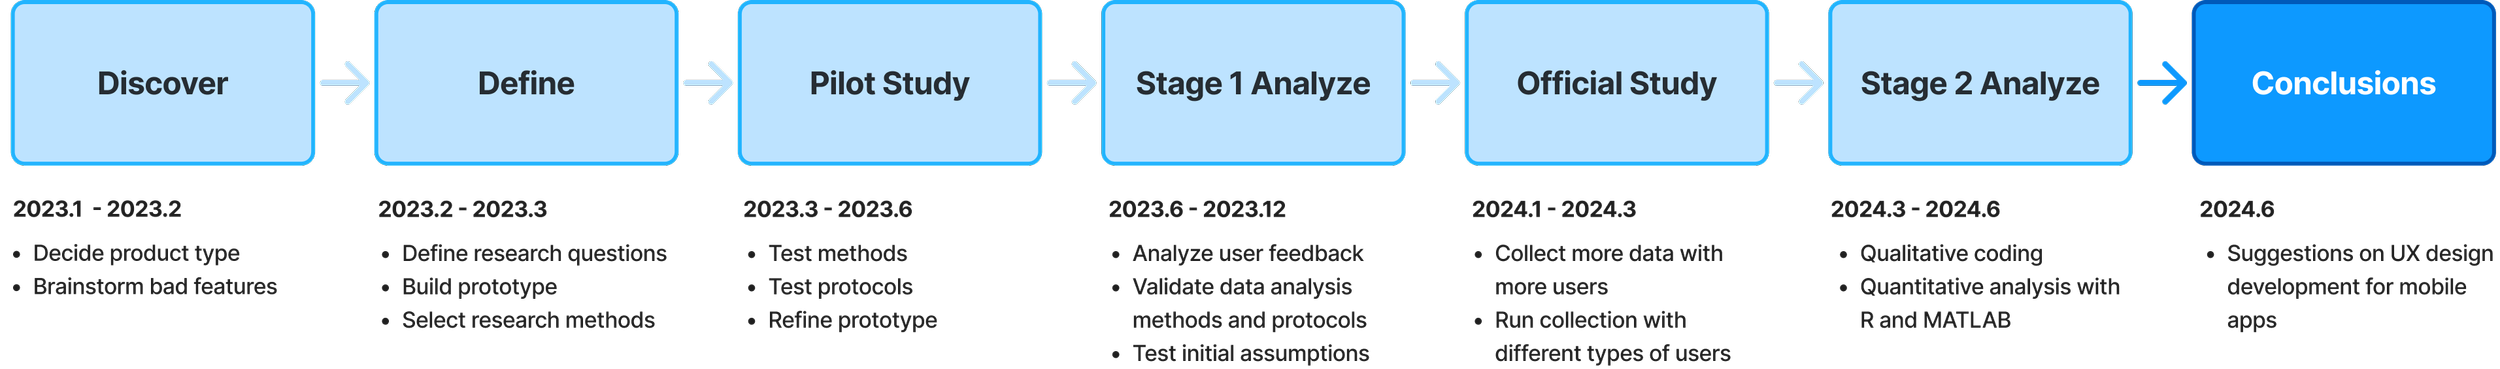
Timeline:
Research Design
In this initial stage, our team aimed to decide the type of the product that we will be using to run the study. We wanted to select a product type that is straight-forward to understand and familiar to our target users — undergraduate students. We also went through multiple brainstorming sessions to narrow down the types of frustrating features we will be testing.
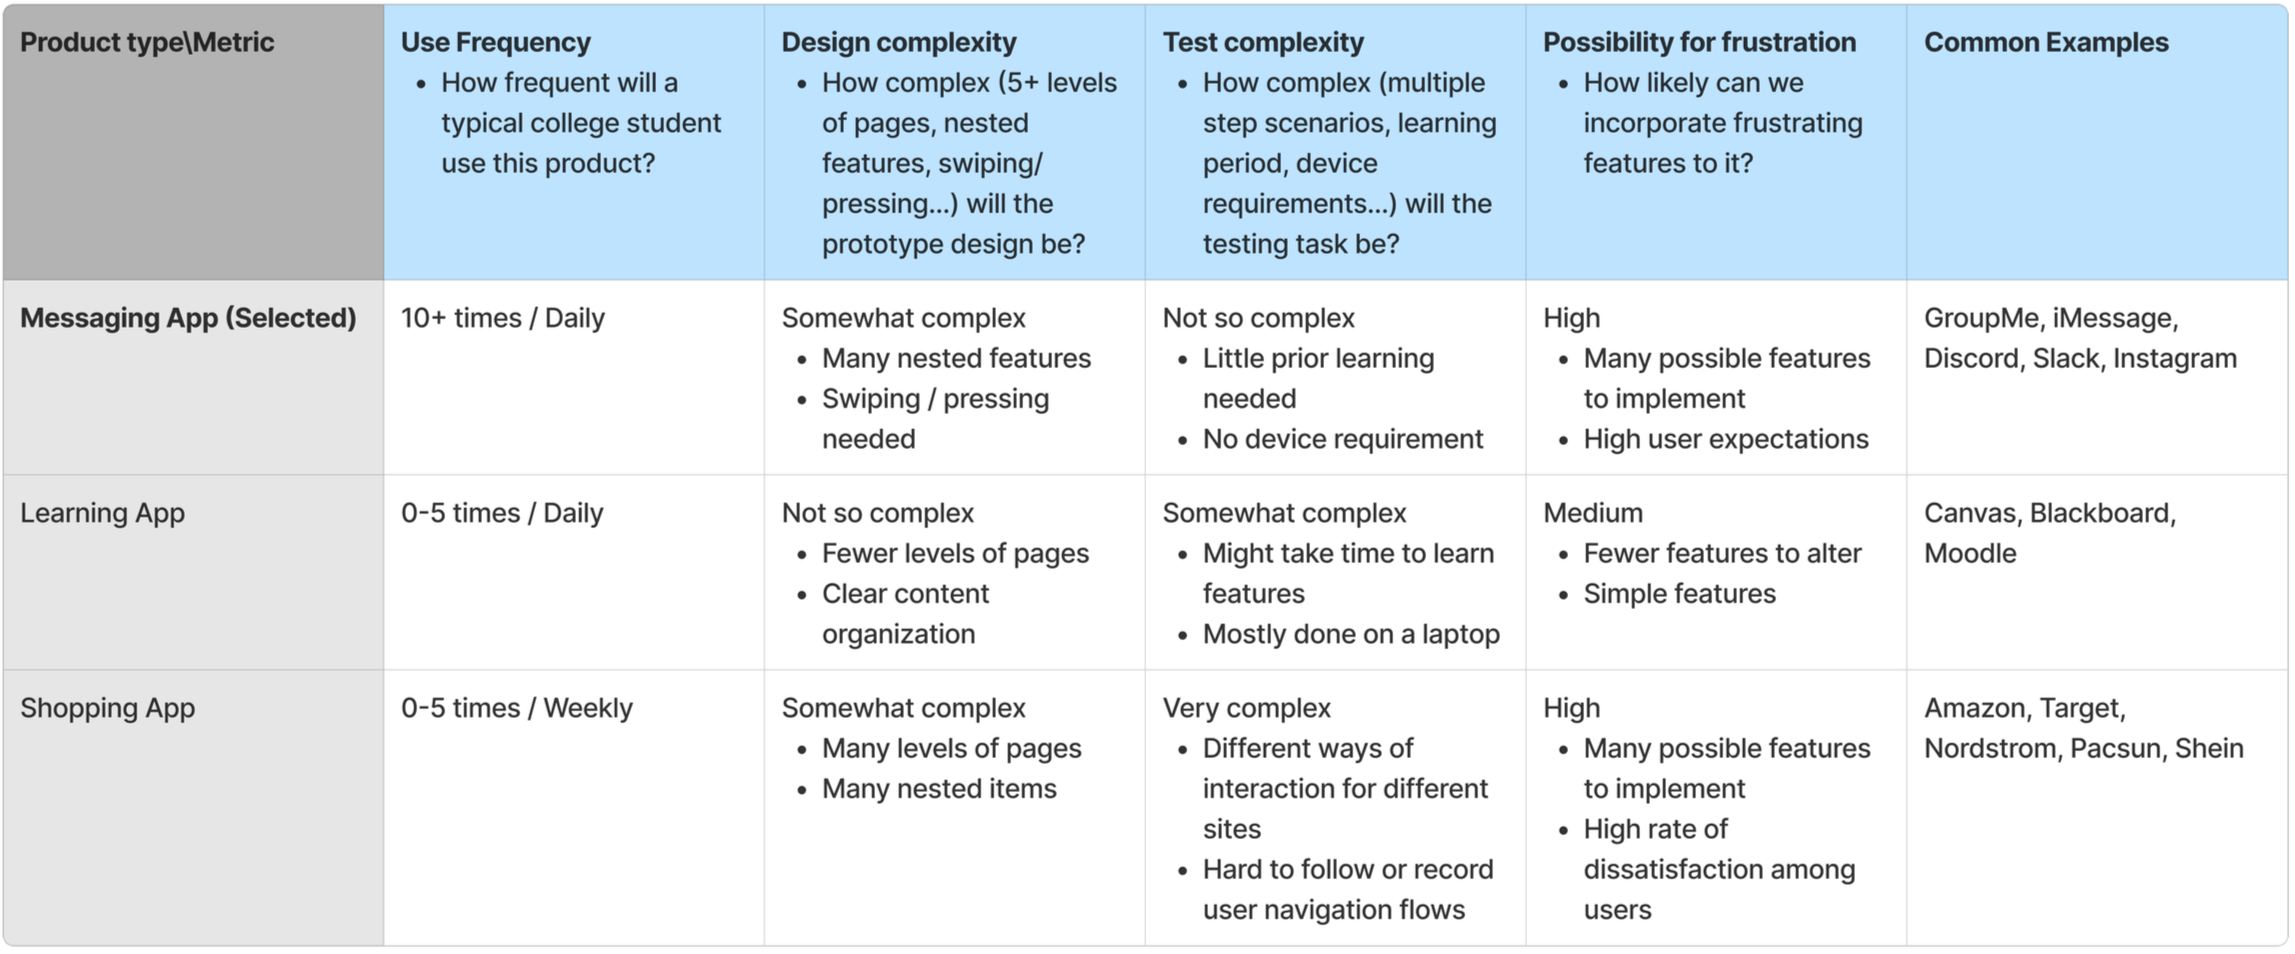
1. Selecting product type: Why testing in a messaging app?
The team created a brainstorm chart for product type selection. The product types were evaluated based on the their use frequency, design complexity, test complexity, and possibility for frustration.
2. Selecting frustrating features: Which features to test?
After a literature review on features that people are commonly disappointed at, the team brainstormed the types of features that we can manipulate in our messaging app and the scenarios for stimulating frustration.
Prototyping
Frames
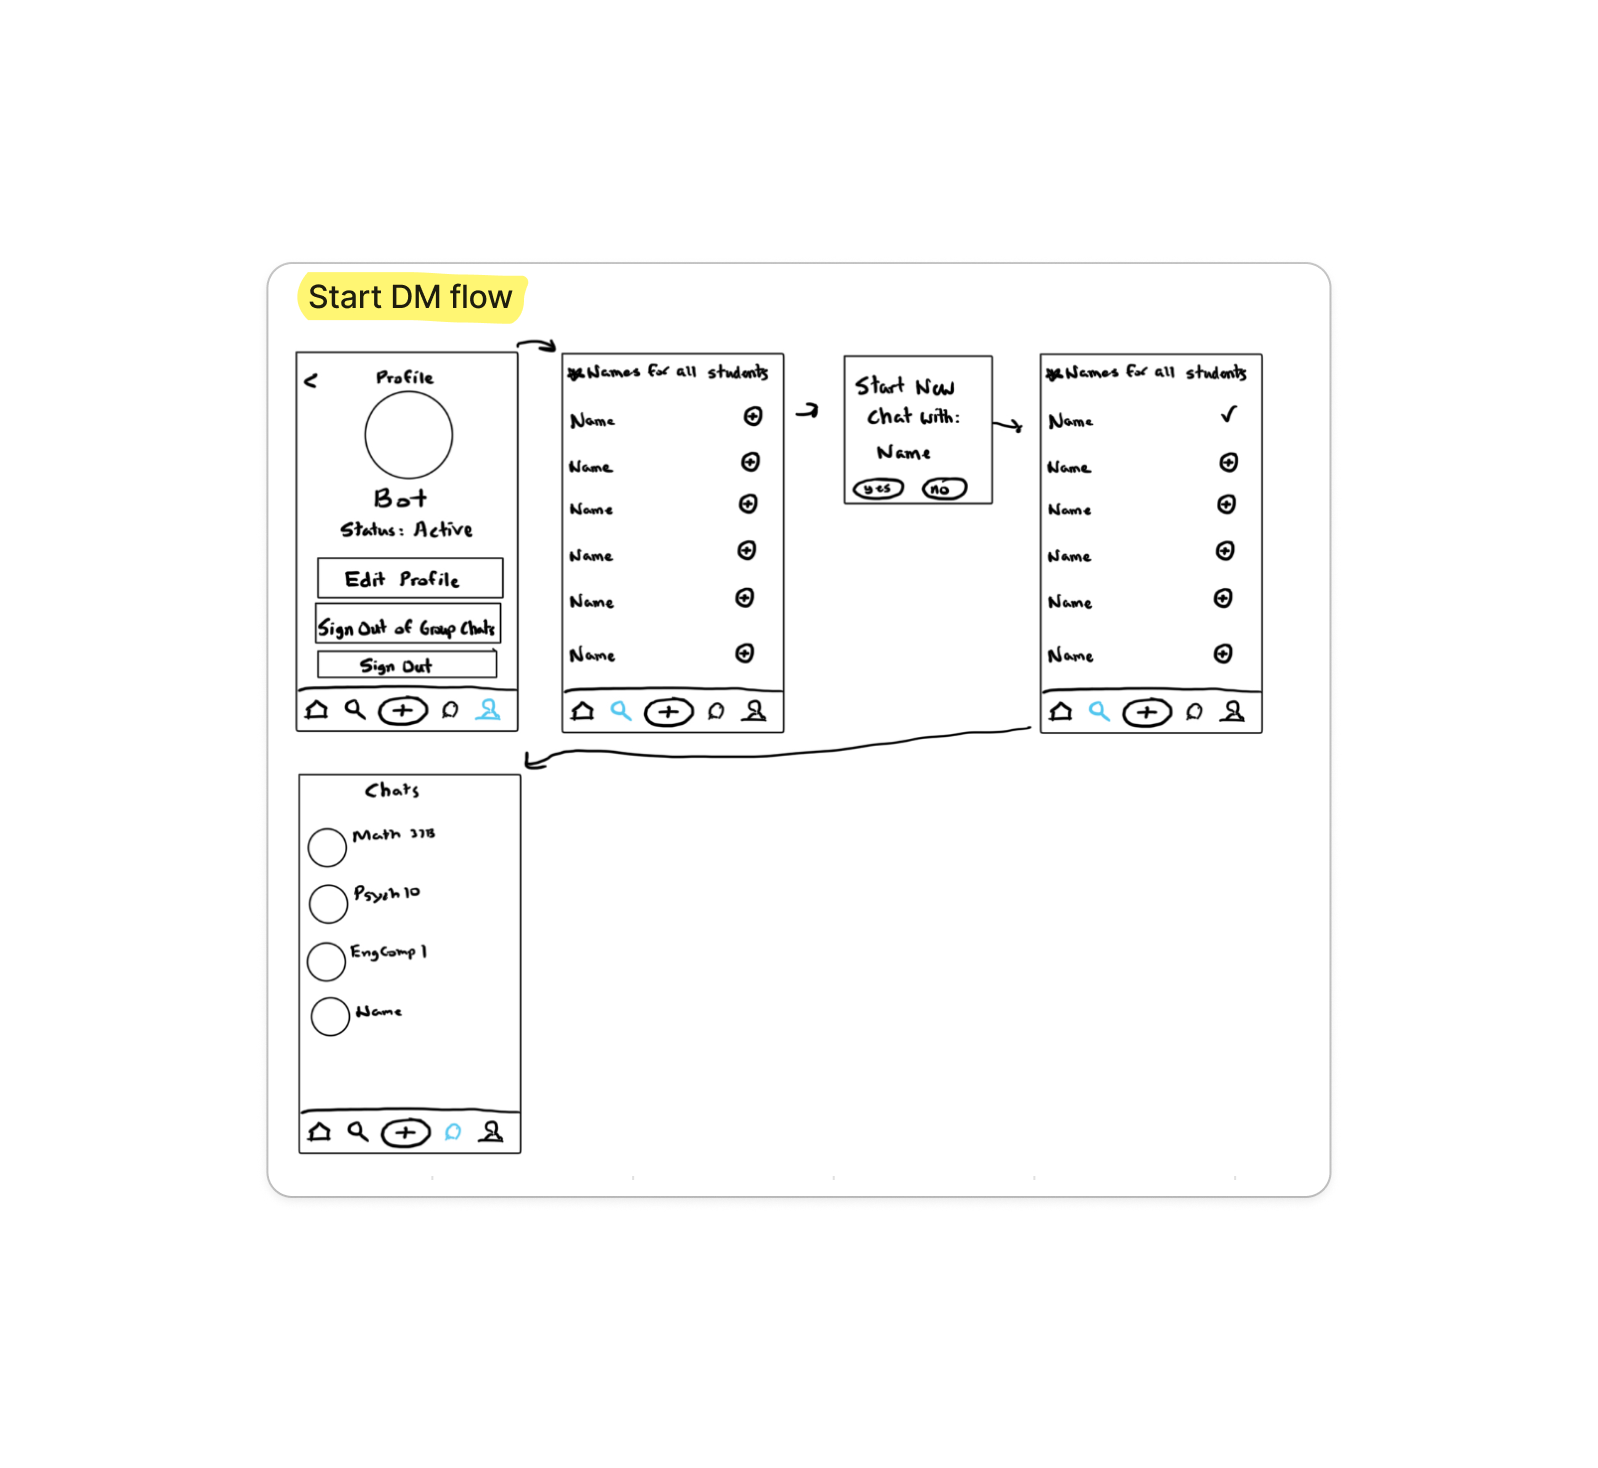
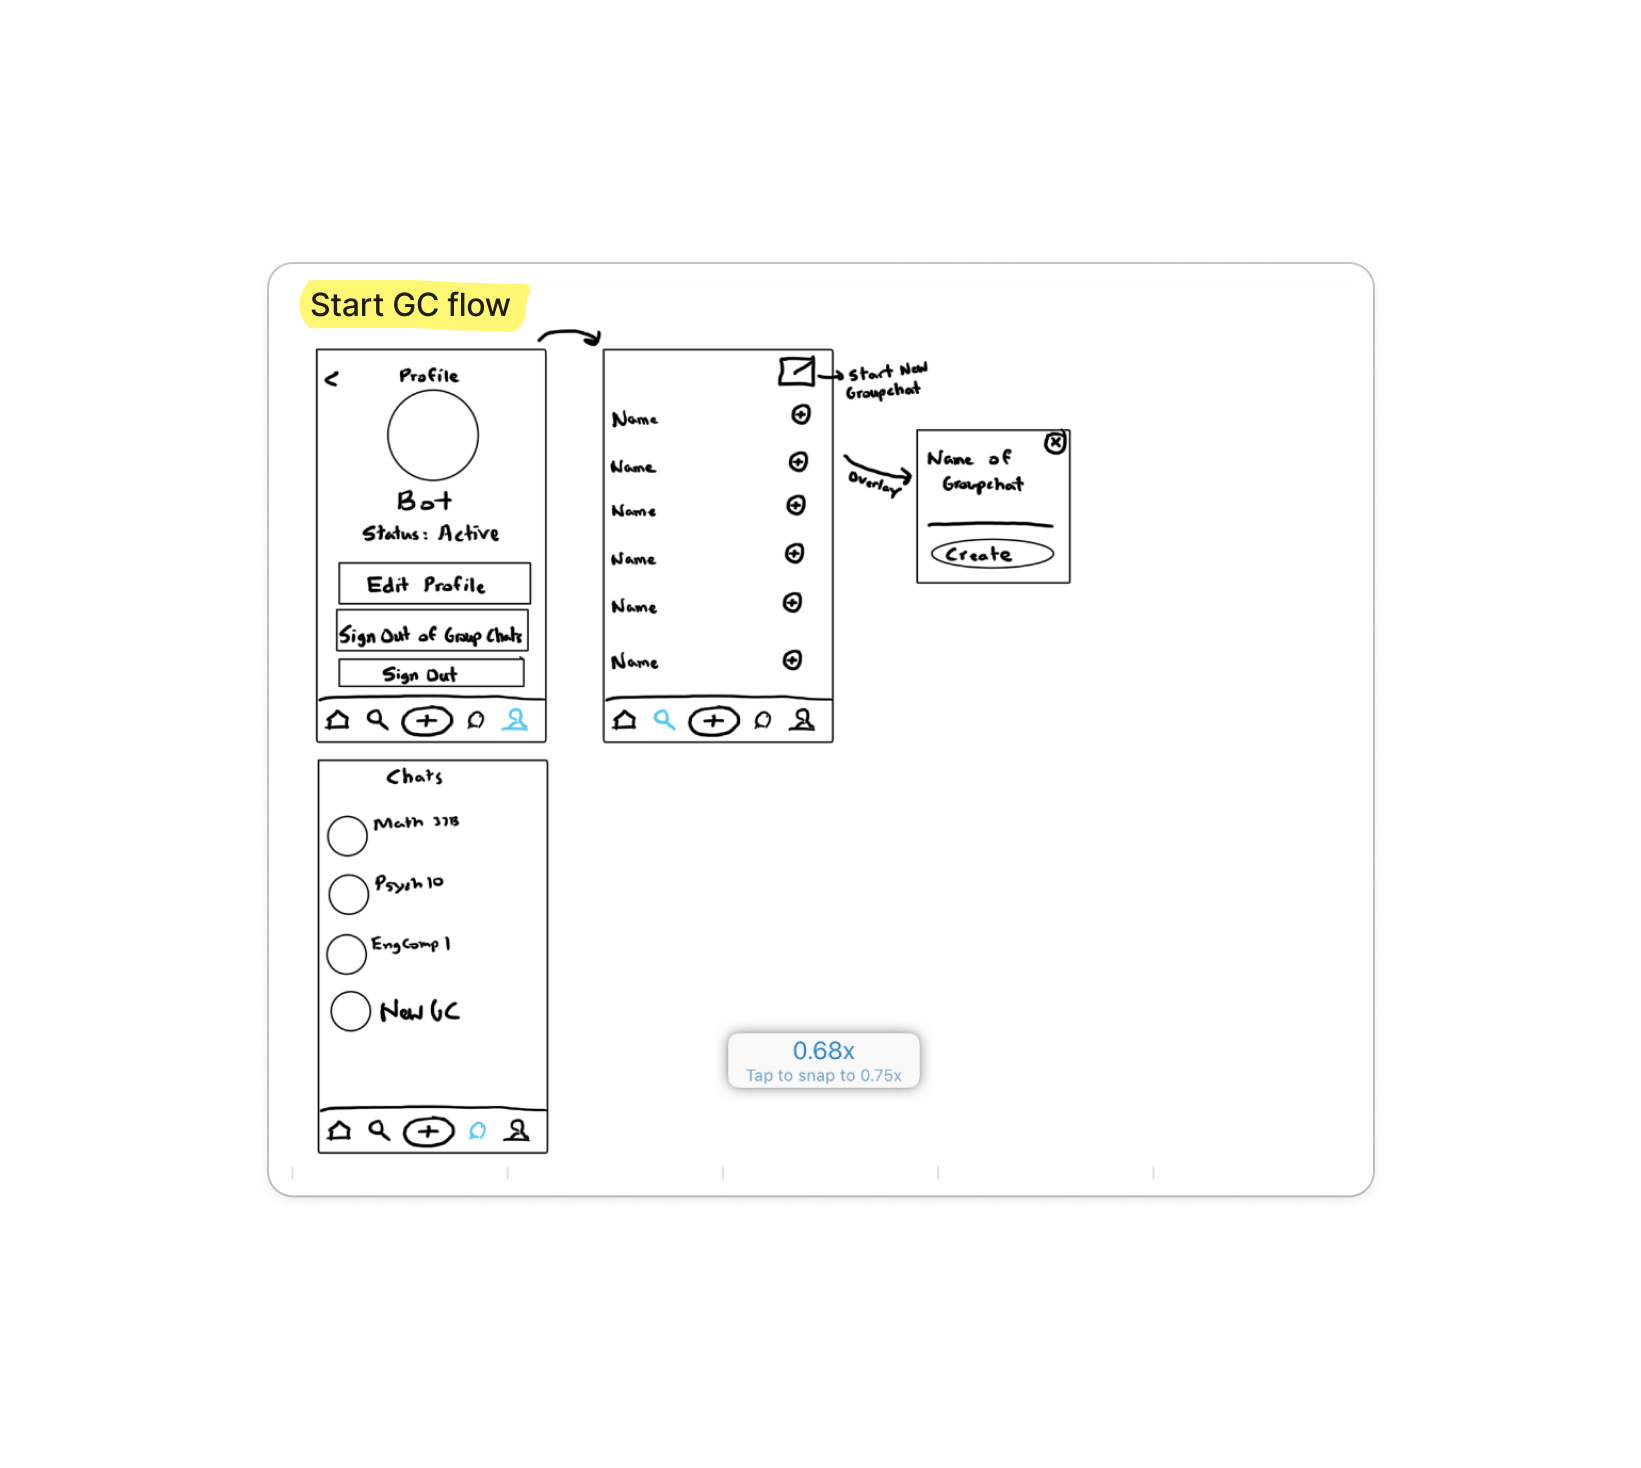
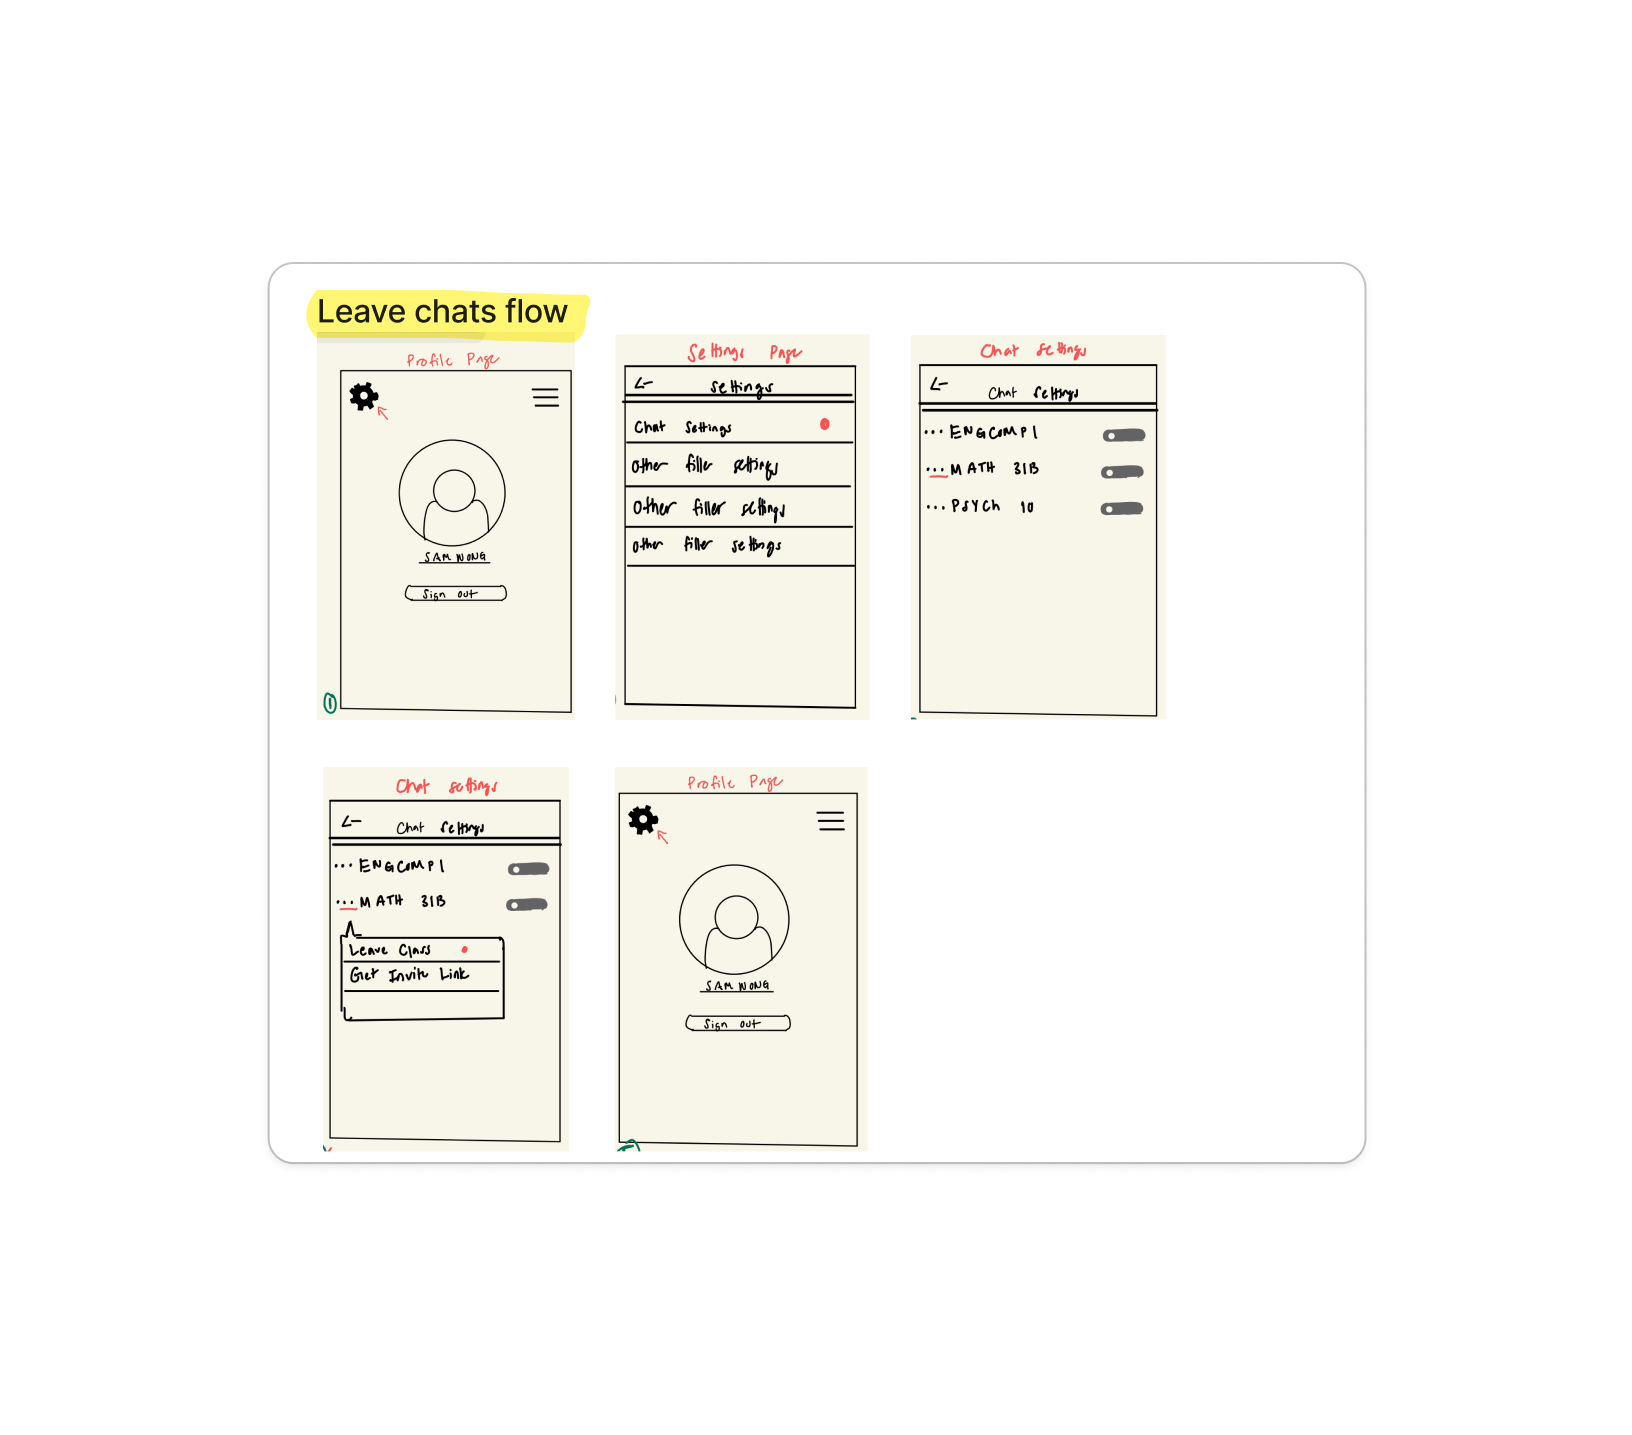
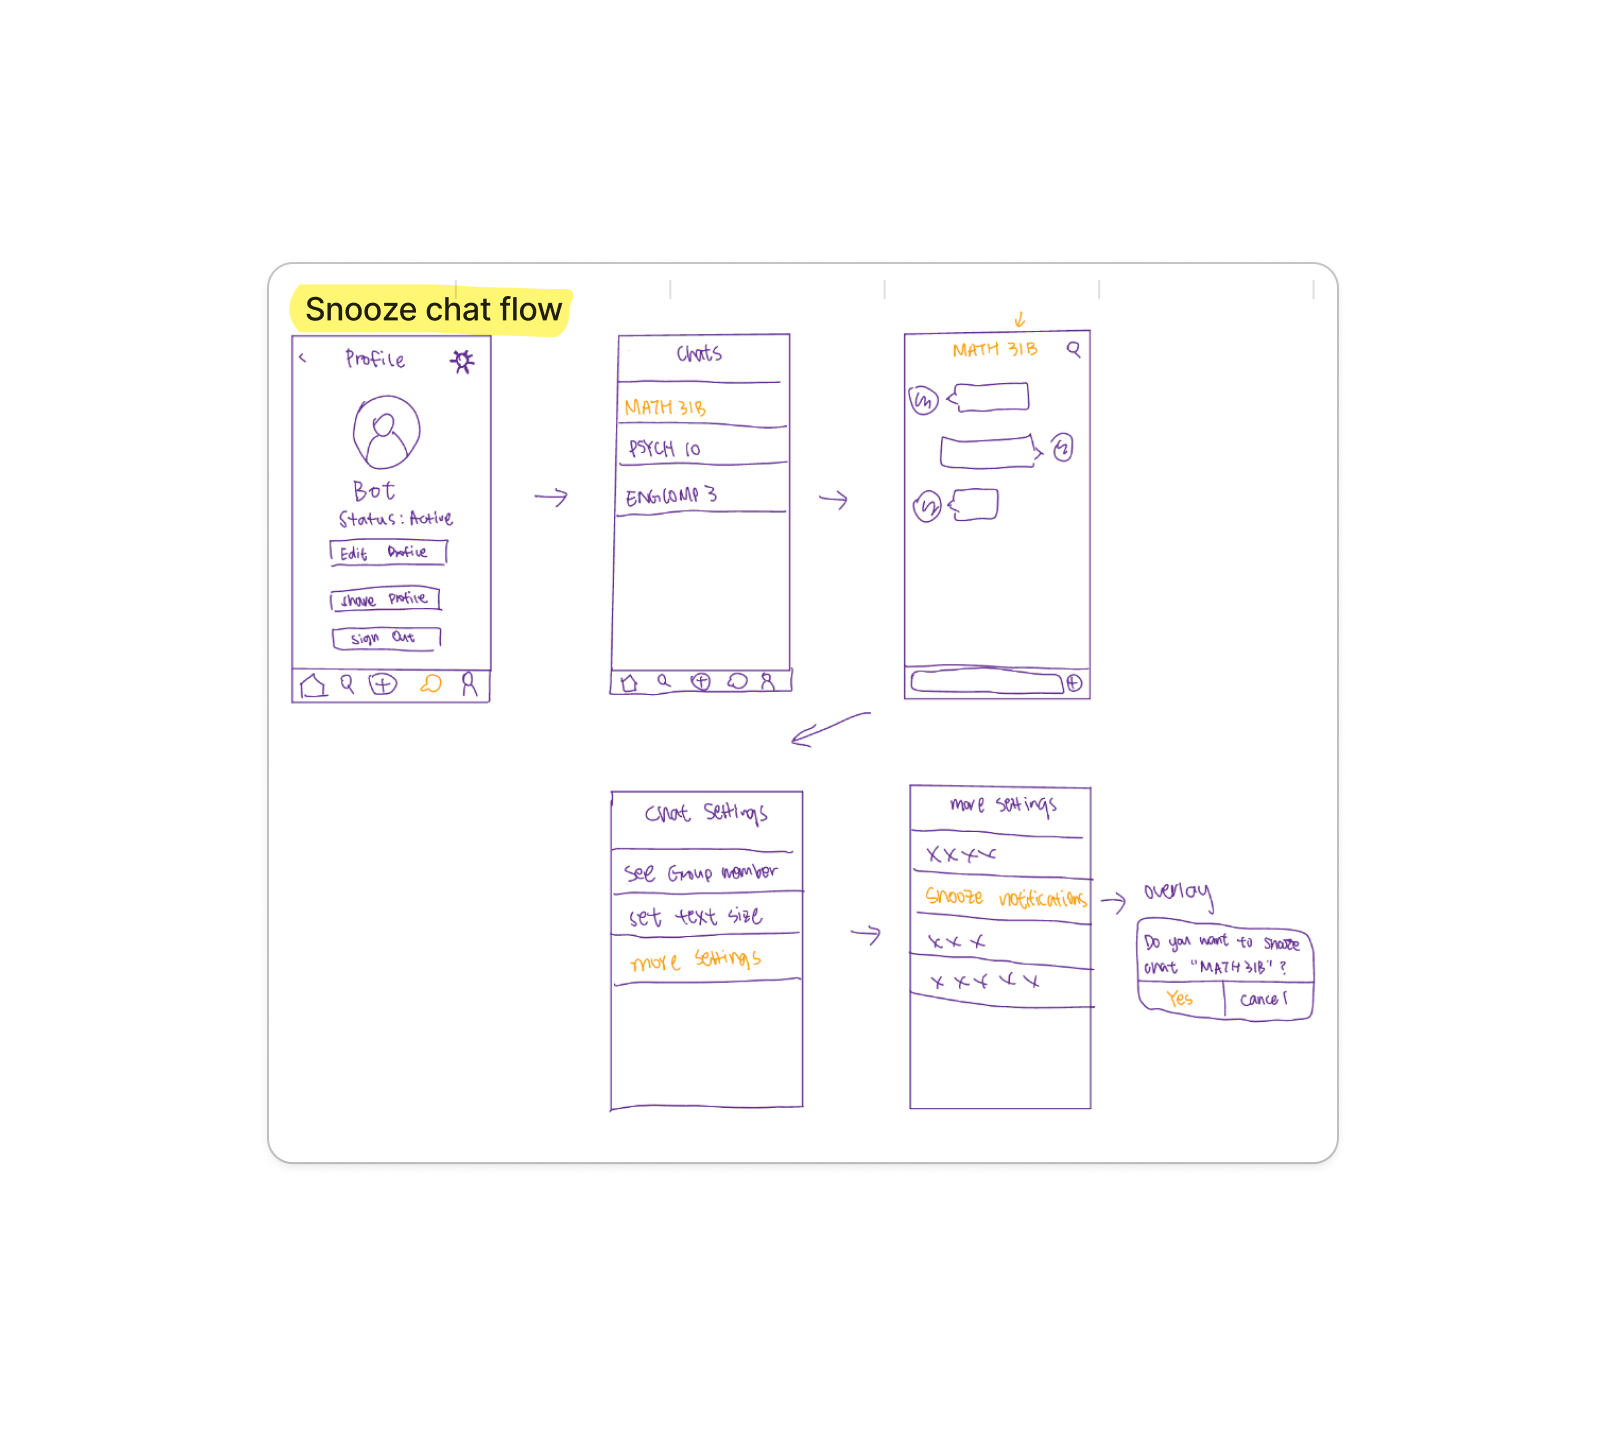
User Flows
Based on the literature search and prototype development, 6 frustrating features were implemented in common user scenarios.
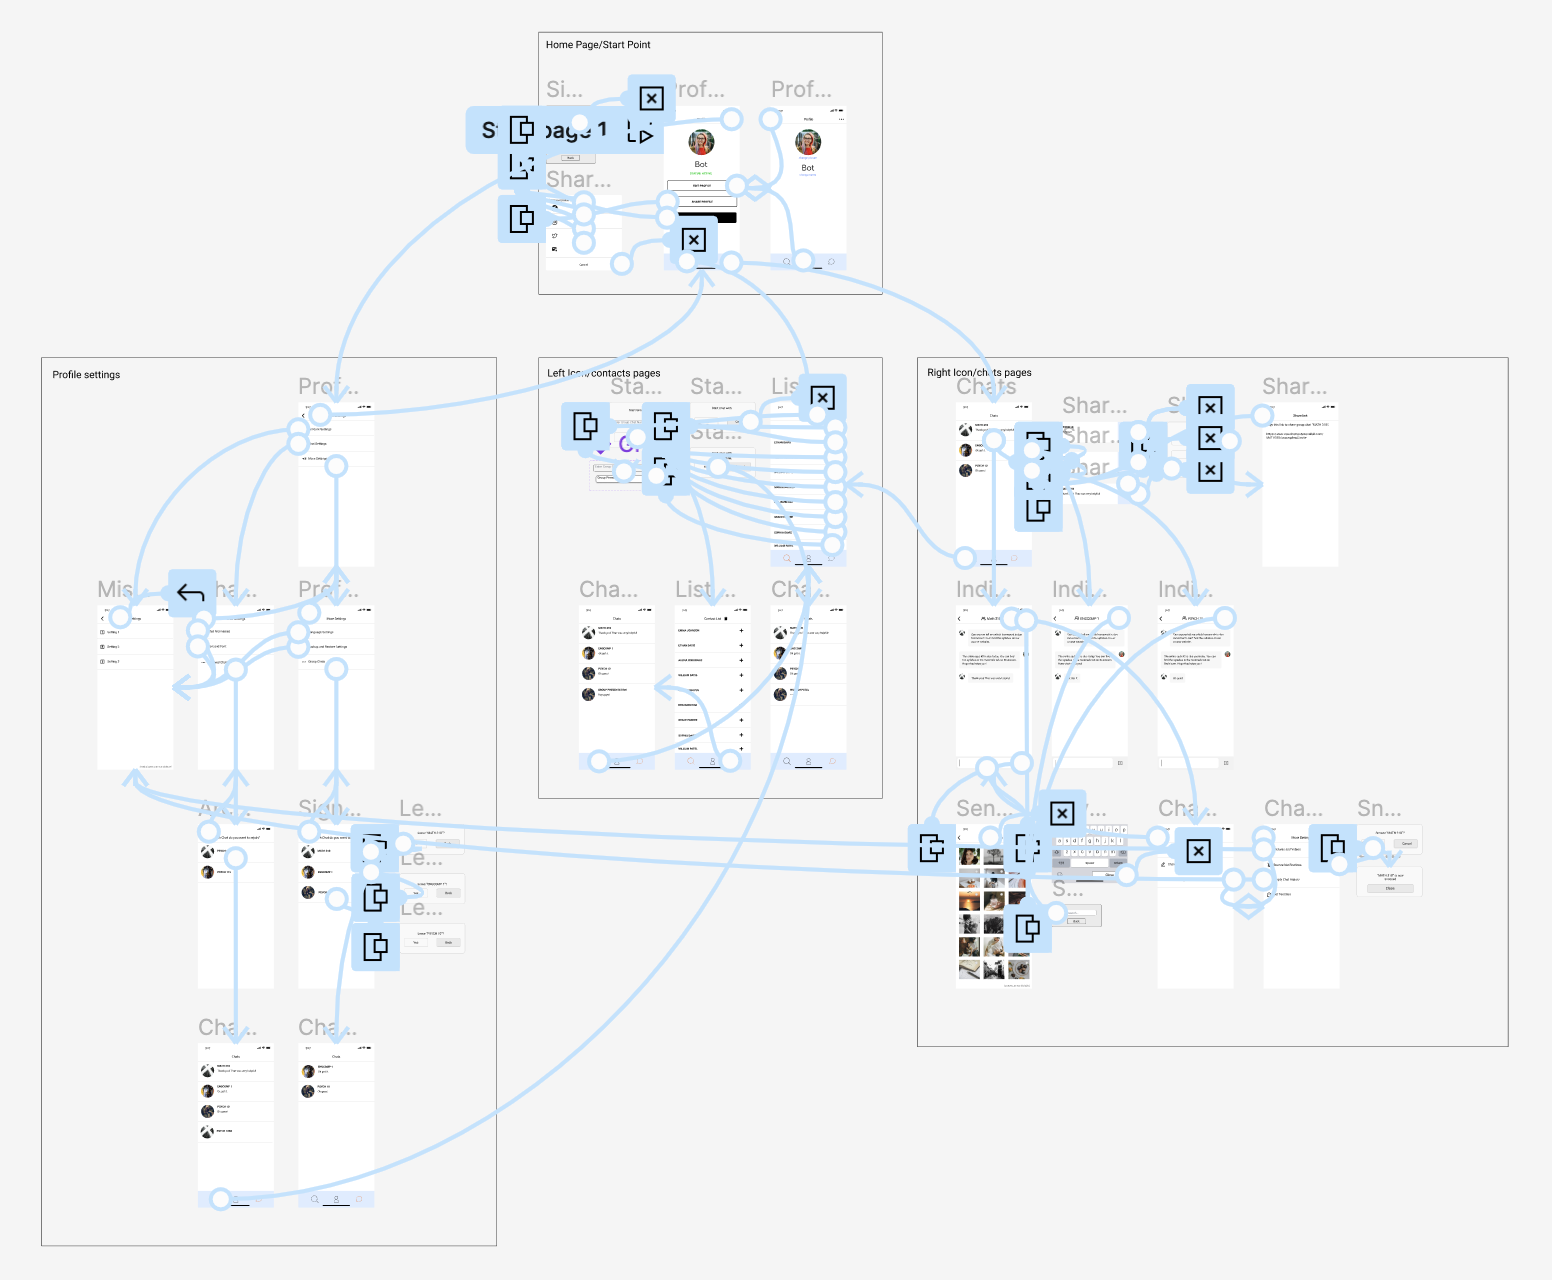
Prototype
Pilot Study
Our main goals during the piloting period were:
Investigate order effects and learning effects to better organize task orders before actually collecting data
Look for a way to operationalize user facial expressions, user flows, and qualitative responses
Our collection results were:
103 groups of data
By researchers in 3 months
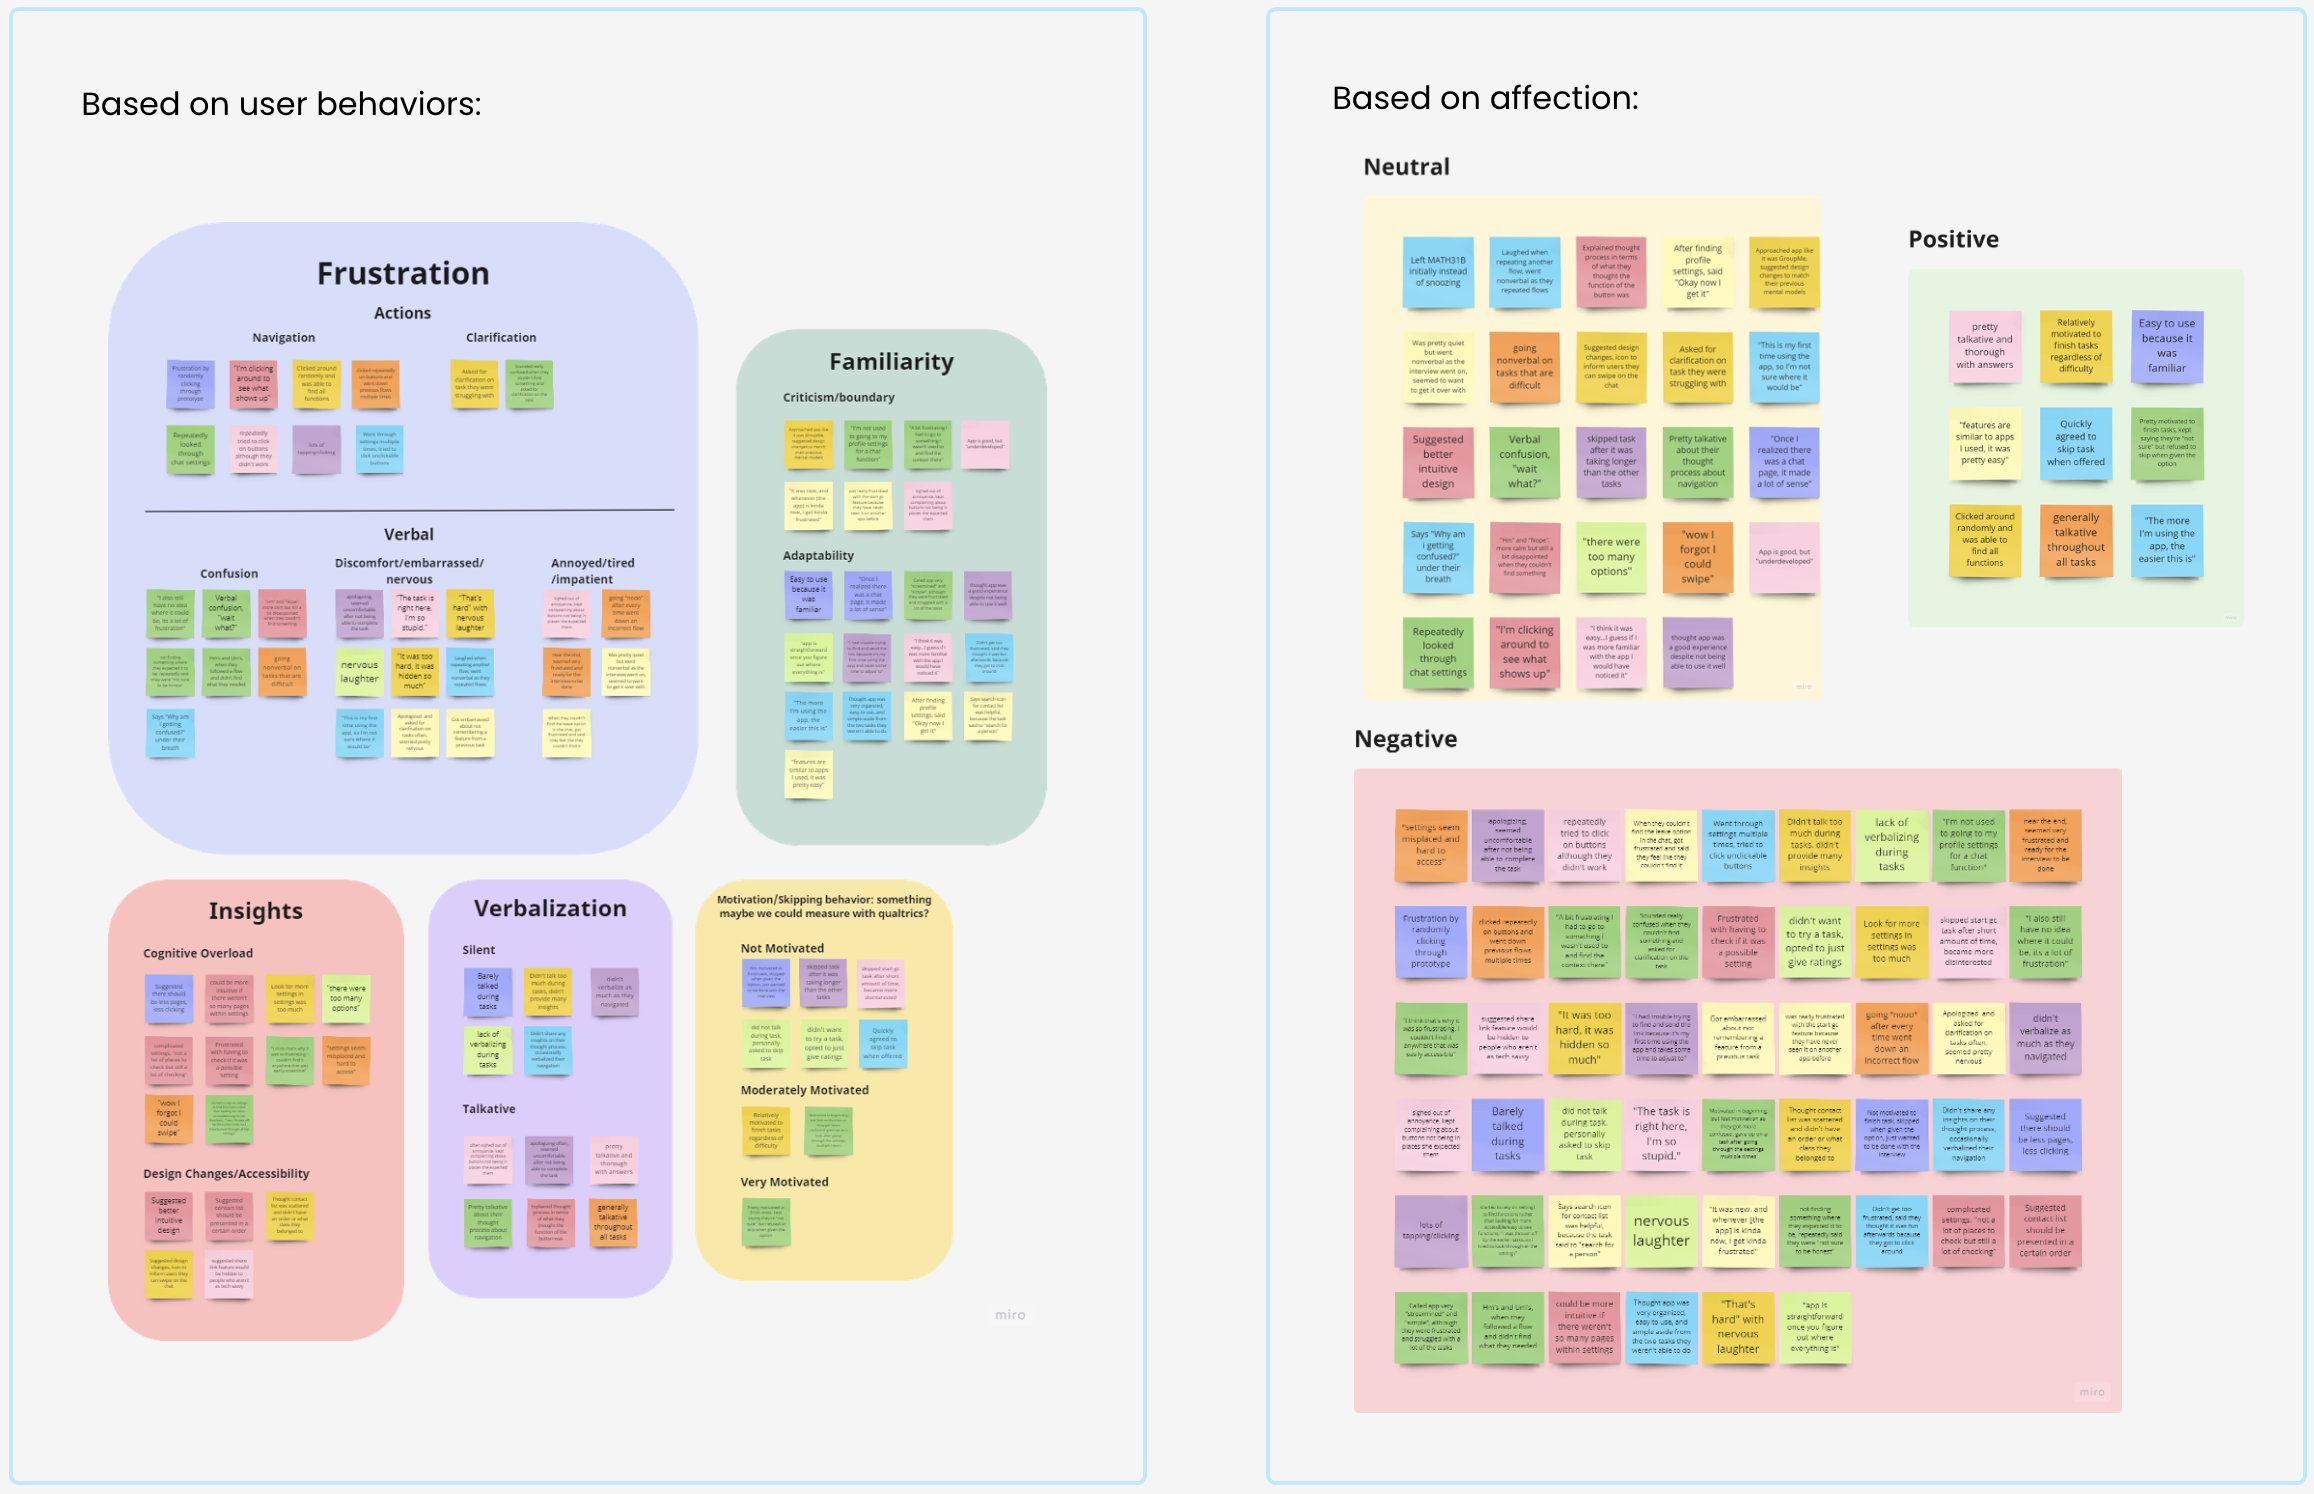
Part 1. Thematic Analysis
Rationale: Based on users’ verbal responses during tasks, we identified five key response categories to understand which app features drew the most attention. This informed the focus of our questions for official data collection. We also coded users’ affective responses to assess frustration levels.
Process:
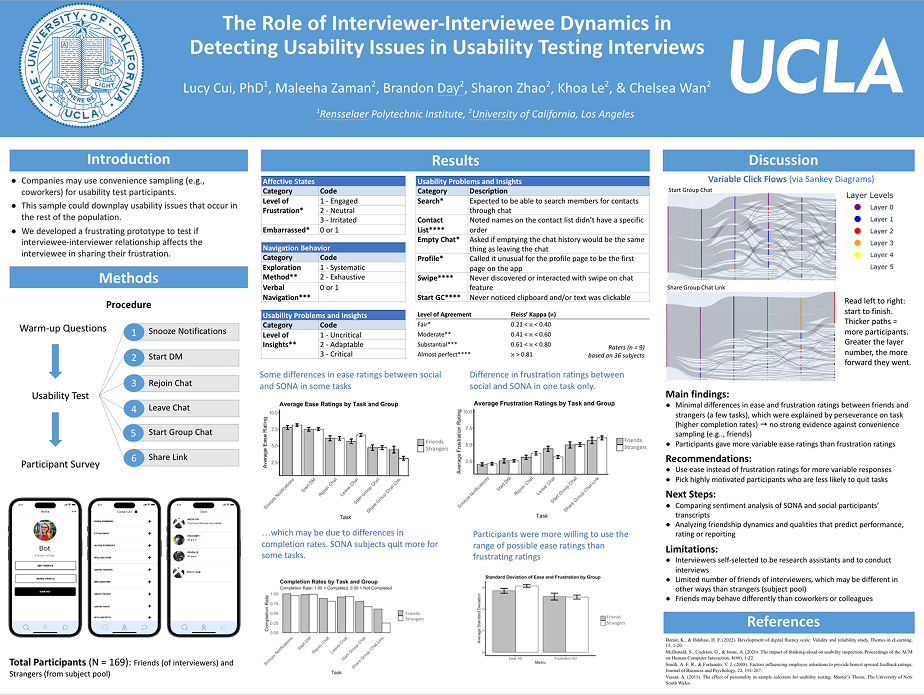
Results:
The 5 big categories of response contents were centered on: frustration, familiarity, insights, verbalization, and motivation.
Negative emotions(57.3%) were reported the most among positive, neutral, and negative responses.
User behavior & verbal responses were coded by affection, navigation behavior, and insights.
Part 2. Quantitative Analysis
Rationale: Our quantitative data analysis was mainly centered on eliminating possible confounding variables for this experiment design. Specifically, we have performed data analysis on whether order of tasks influence user ratings and frustration levels.
To determine whether a best order exists, we evaluated the independence between the orders and each of learning and ratings using chi-square tests.
Process:
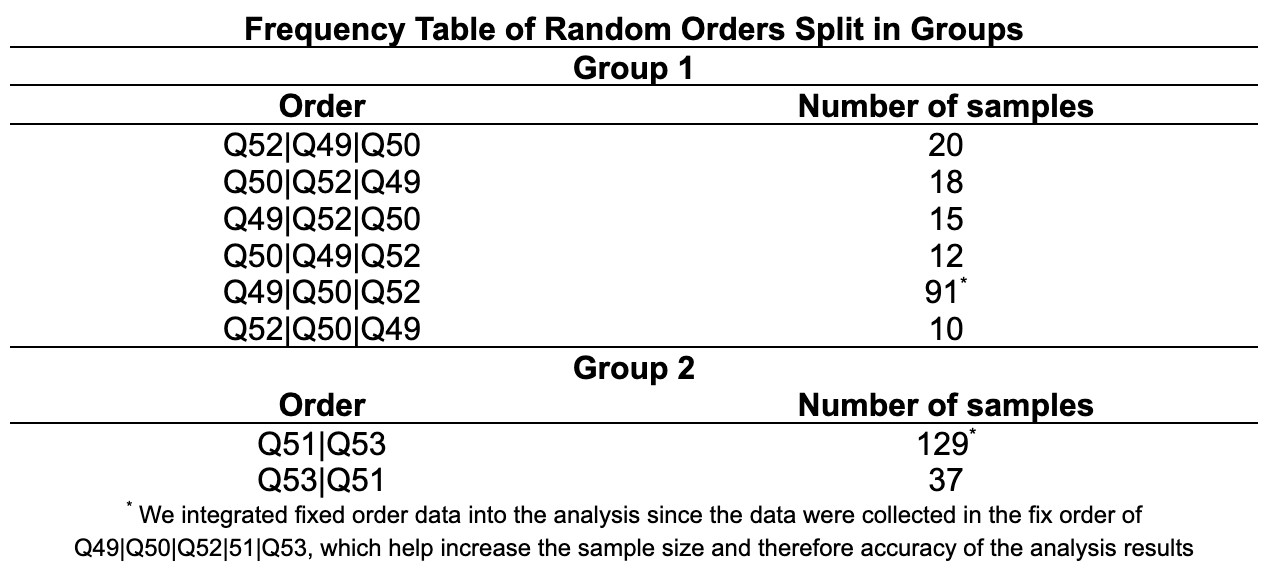
1. We split the investigation into two parts. The first part is evaluating the independence of order and learning/ratings among the first group of questions that were randomized together (Q49, Q50, Q52). The second part is evaluating the other two questions that were randomized together (Q51, Q53).
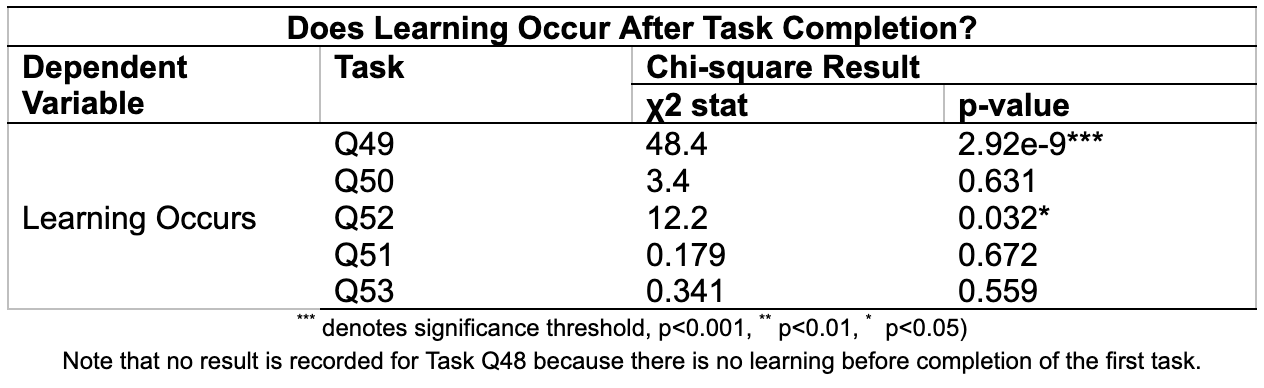
2. We conducted chi-square tests to explore whether dependency exists between task order and learning rates
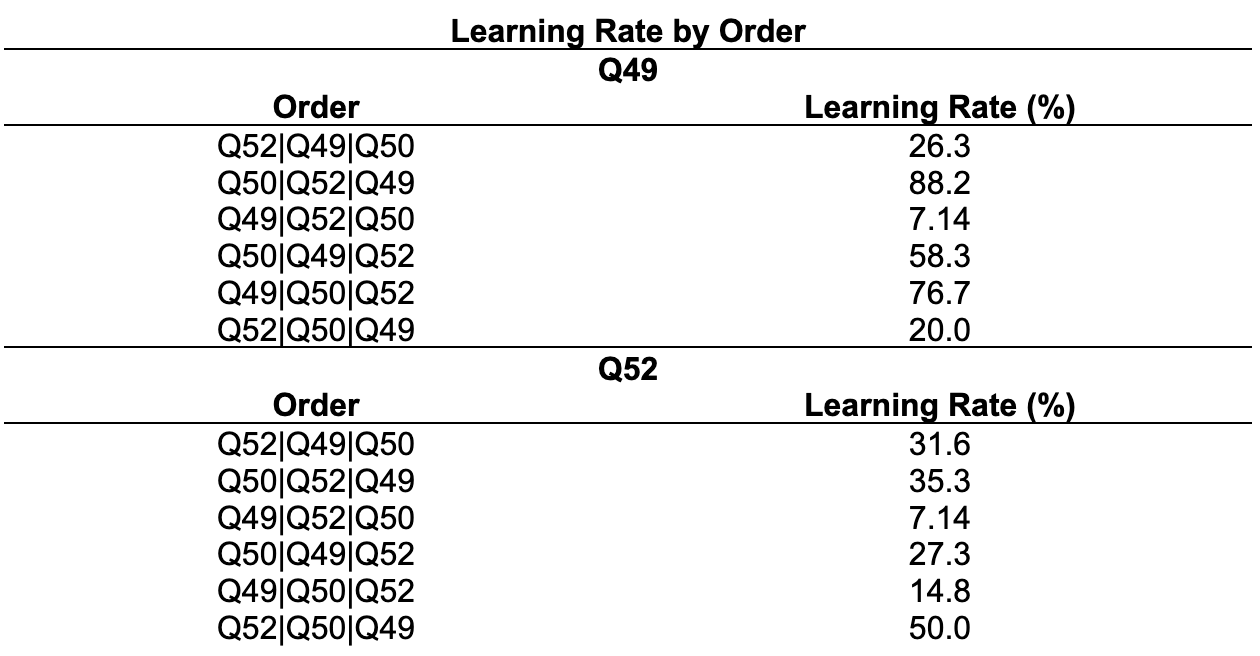
3. We found that Q49 and Q52 has significance difference in learning for different task orders. We compared across the mean learning rate across different task orders for Q49 and Q52. In both cases, learning is most reduced for task order Q49|Q52|Q50.
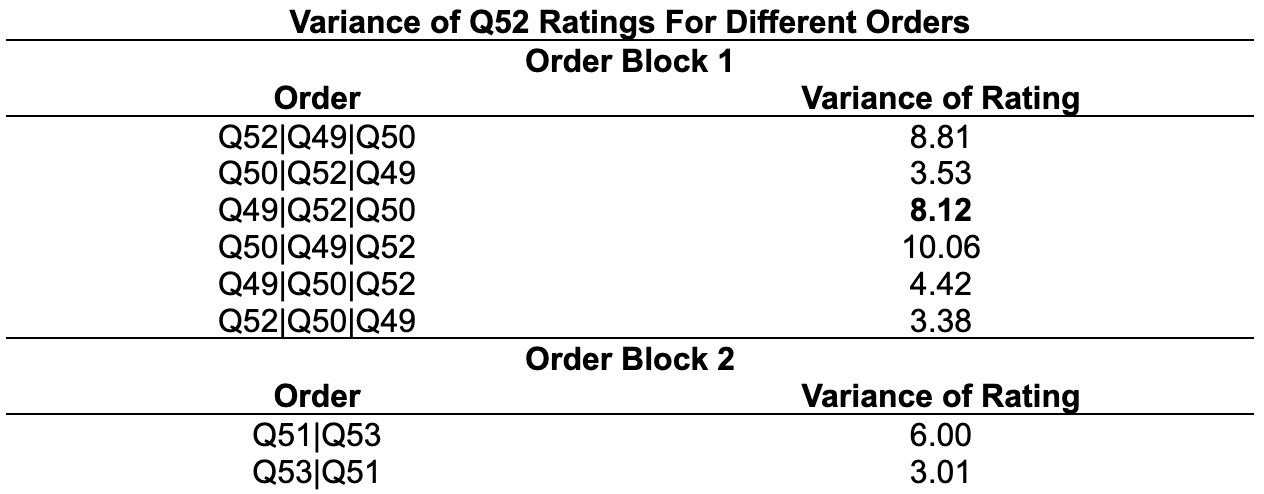
4. Using Levene’s tests, we found that the variance of Q52 ratings differs across different orders for both random blocks. We then compared the variance of Q52 ratings for the different order blocks.
Conclusion:
Order Q50|Q49|Q52 has the highest rating variance among the first order block and Q51|Q53 the second order block. However, because we prioritize learning rate reduction. We choose Q49|Q52|Q50 over Q50|Q49|Q52, which gives 3rd highest rating variance for Q52.
Our final optimal experiment order is thus Q49|Q52|Q50|Q51|Q53.
Official Study
Data Collection
Duration: 30 minutes.
Setting: Zoom.
All of us followed a discussion guide that standardized the collection process to minimize possible confounding variables brought by wording or researcher personality.
Data Analysis
Correlation Analysis for qualitative codes
All sessions were coded in the format of the following example.
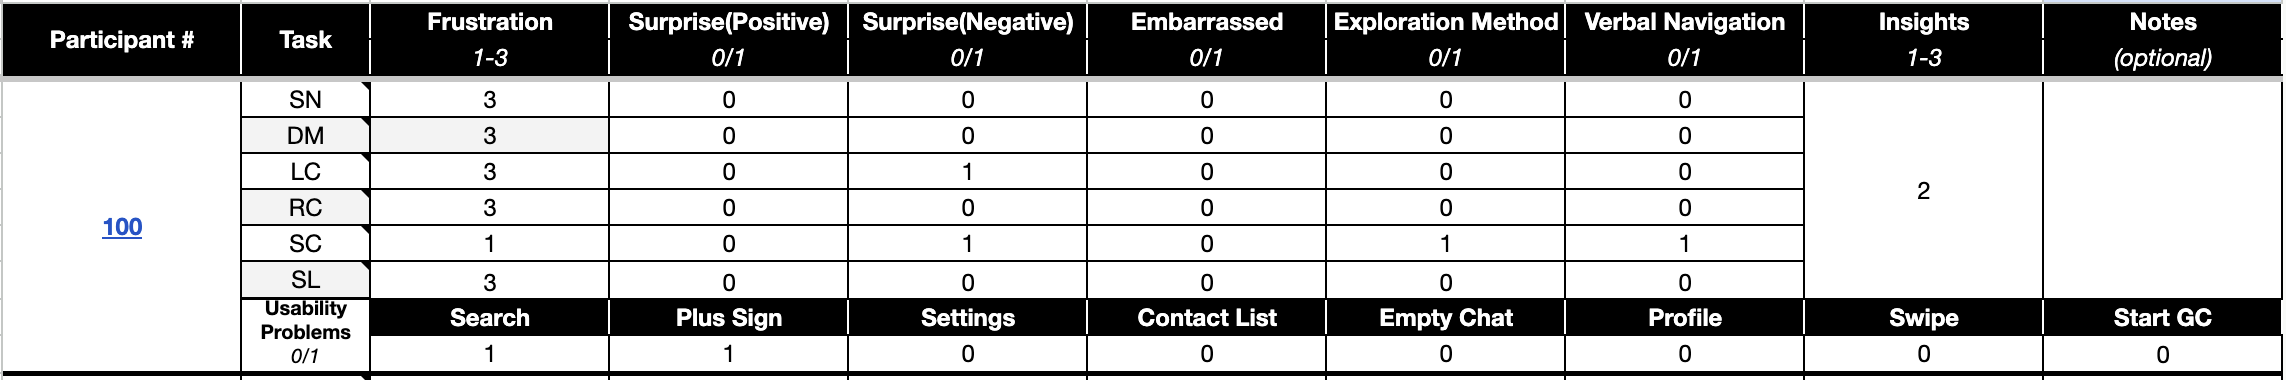
The primary objective of this analysis was to measure the agreement between raters on specific user behaviors and emotions during the sessions. We utilized Pearson’s Correlation to assess the strength and direction of the linear relationship between the raters’ scores across all sessions.
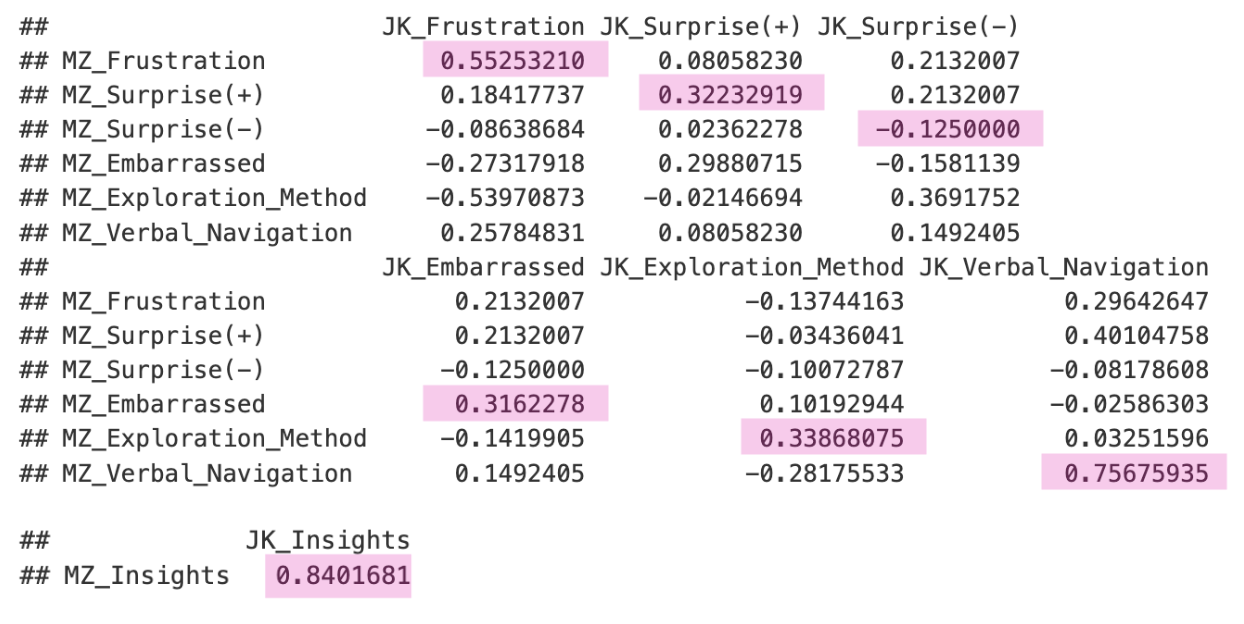
Pearson’s Correlation
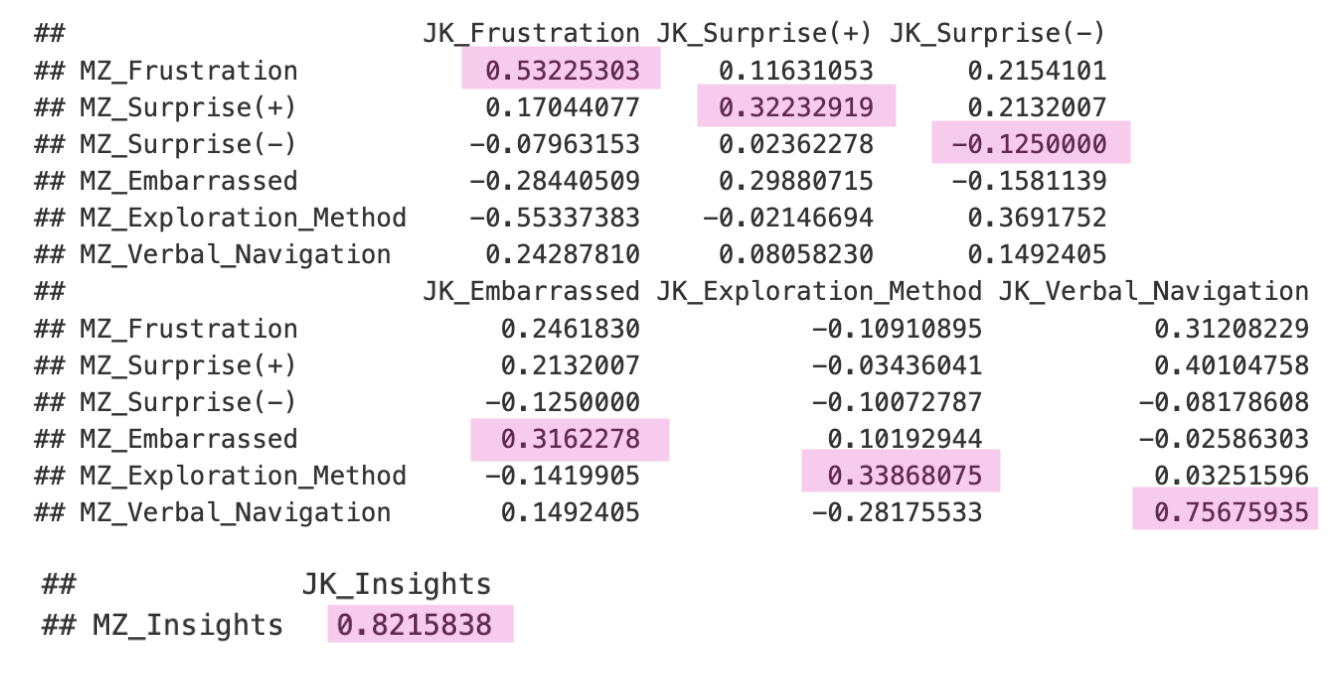
Spearman’s Correlation
Quantitative Analysis for variables that can affect user behavior
We conducted correlation studies that provides insights into how these variables relate to each other:
Quit Rate (quit_count): The number of times users quit the experience.
Openness to Experience: A personality trait that might affect how users engage with a task.
Total Confusion Count (tot_confusion_cnt): The number of instances where users exhibited confusion.
The correlation analysis aimed to uncover relationships between these metrics. For example, higher "quit rates" may correlate with increased confusion, indicating that when users are confused, they are more likely to abandon the task. Similarly, understanding how "openness to experience" influences these outcomes can provide valuable insights into user behavior.
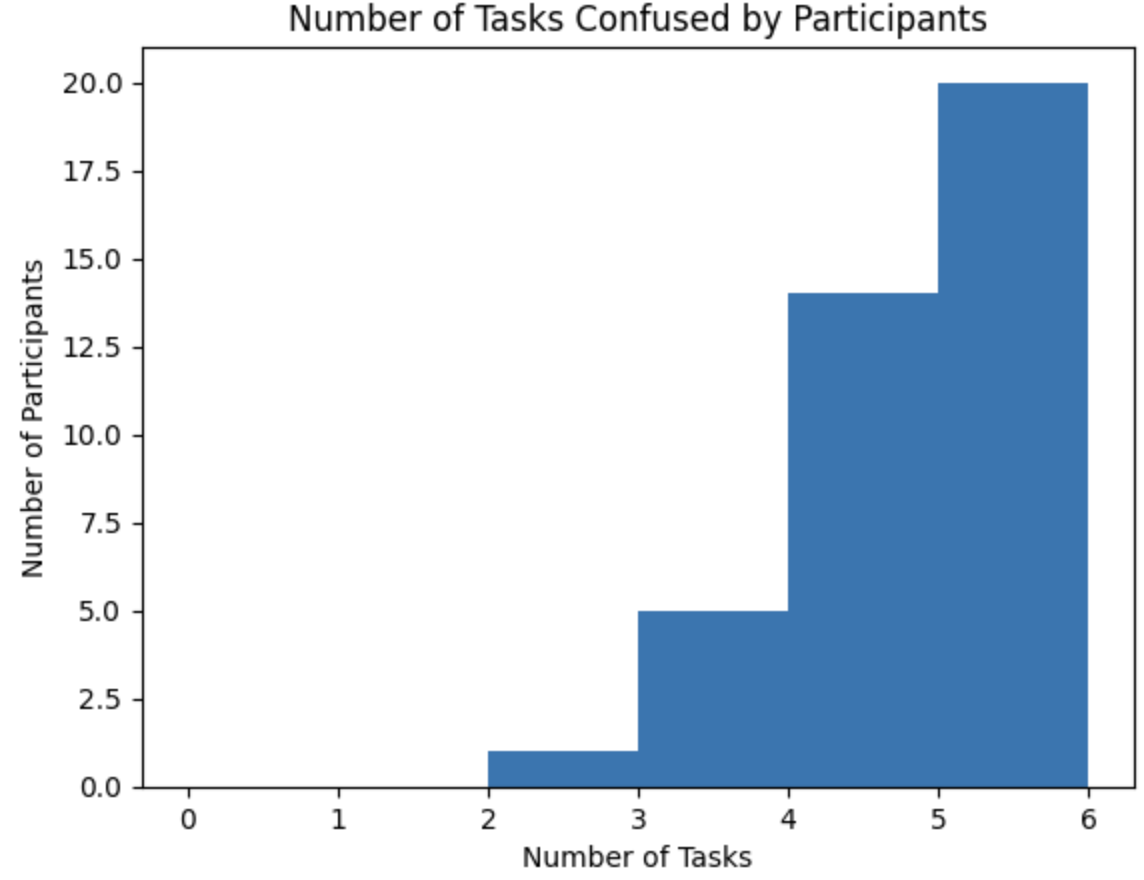
1. Number of Tasks Confused by Participants
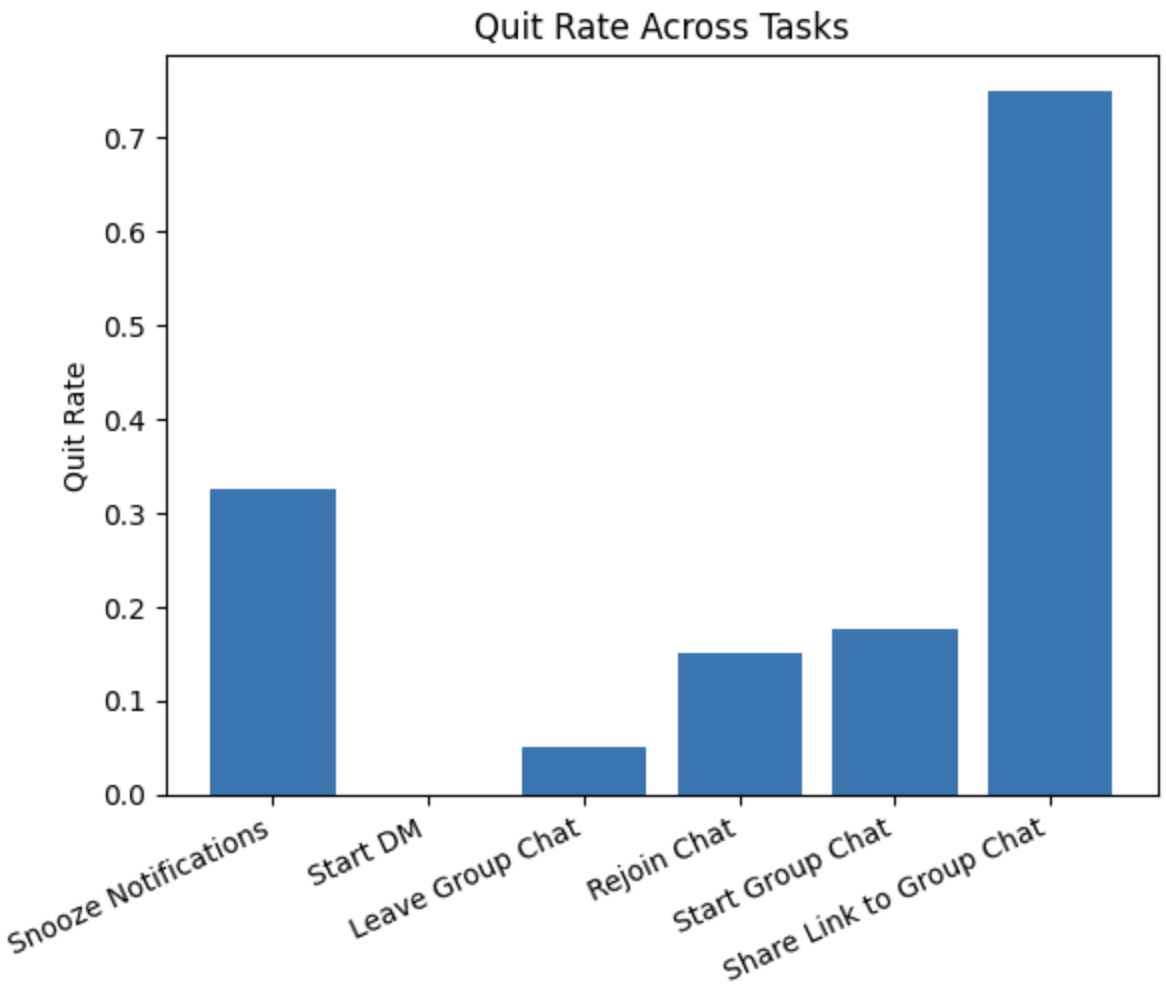
2. Quit Rate Across Tasks
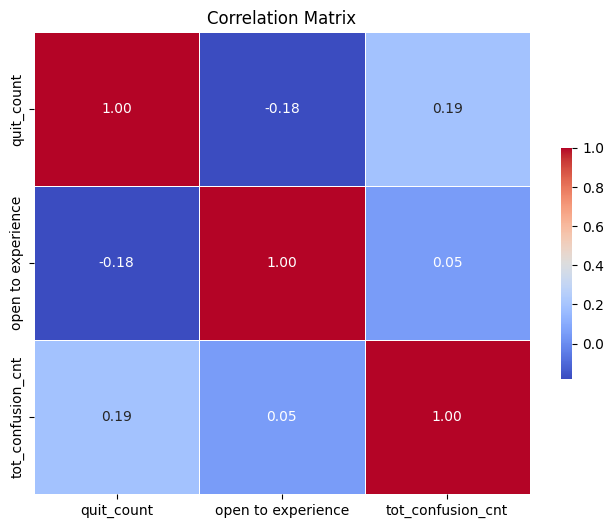
3. Correlation Matrix
Result
High Cognitive Load (Fig. 1): Most participants were confused by 5–6 tasks, suggesting significant cognitive challenges across the interface.
Problematic Task “Share Link to Group Chat” (Fig. 2): This task had the highest quit rate, indicating serious usability issues.
Low-Friction Task “Start DM” (Fig. 2): Marked by low quit rates and high ease ratings, suggesting good task design.
Correlation Insight (Fig. 3): Positive correlation (r = 0.19) between confusion count and quit count implies confusion may contribute to task abandonment.
Recommendations
Based on the findings from this UX research study, several key insights and recommendations emerge:
Validation for frustrating features
The data indicates that a majority of participants experienced confusion during at least five or six tasks. This suggests that the overall cognitive load of the tasks may have been too high. To improve user experience, it is essential to simplify complex workflows, especially for tasks like "Share Link to Group Chat," which had both the highest confusion and quit rates.
Effect of user personality traits
The slight negative correlation between "openness to experience" and "quit rate" suggests that personality traits may influence how users interact with certain features. Users who are more open to new experiences are less likely to quit, even when faced with challenges. This insight could be used to personalize user experiences. Designers can offer more adaptive features or support mechanisms based on user personality.
Ease over frustration for rating type
Participants provided more meaningful feedback when we paired ease-of-use ratings with frustration ratings. While ease ratings alone suggested tasks were “simple,” frustration ratings uncovered moments where users still felt blocked, confused, or dissatisfied. Using both metrics together created a more nuanced and variable response set.
Impact
Research poster presented at Psychonomic Society 2024 Annual Meeting